
- The PEPE coin MVRV ratio of 1.34 signals a possible market bottom, and traders are getting optimistic about a potential 50% rally ahead.
- The PEPE Money Flow Index (MFI) recently surged from an oversold level of 17.25 to indicate increasing buying pressure.
The meme coin sector is once again buzzing with activity with the frog-themed PEPE coin (PEPE) coming on investors’ radar, presenting a rare buying opportunity for a mage rally ahead.
Following its all-time high levels of $0.000014 earlier in May 2024, the PEPE coin price has corrected more than 50% so far. Amid this correction in the last 90 days, several short-term traders have been sitting on losses. However, traders are eying a fresh buying opportunity now gearing for another 50% rally from here onwards. As reported by Crypto News Flash, the PEPE whale activity has also been on the rise.
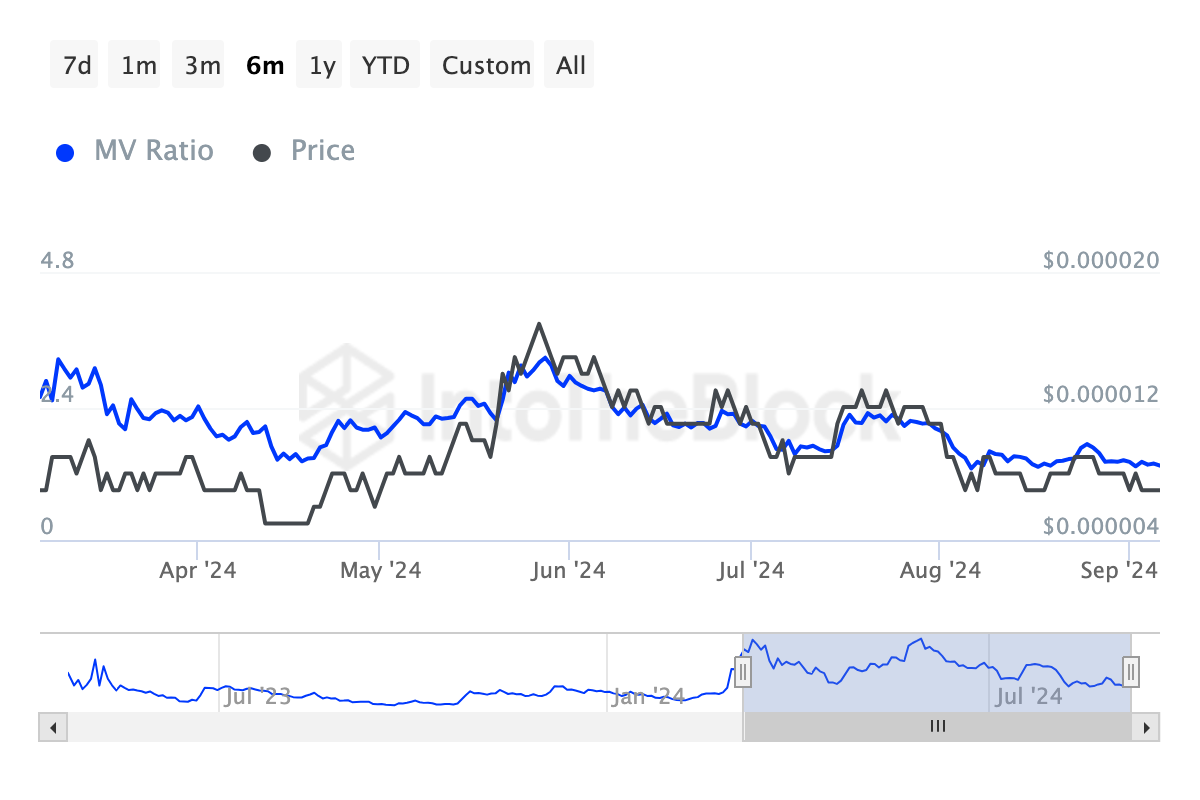
According to the data from IntotheBlock, the PEPE coin’s market value to realized value (MVRV) currently stands at 1.34. This metric is particularly useful for predicting market peaks and lows by comparing the asset’s spot market value to the value investors originally invested in.
A higher MVRV ratio indicates that investors have more unrealized profits and may be more likely to sell. In contrast, a lower ratio suggests that investors, possibly holding at a loss, are less likely to sell at a reduced value.
During the PEPE coin’s all-time high in May this year, its MVRV ratio shot up to 3.29. Thus, with the current ratio at 1.34 and PEPE priced at $0.0000071, it may indicate the token has reached a market bottom. Thus, per the CNF report, the PEPE coin appears undervalued and poised for a further rally ahead.
PEPE Coin Price Chart and Money Flow Index
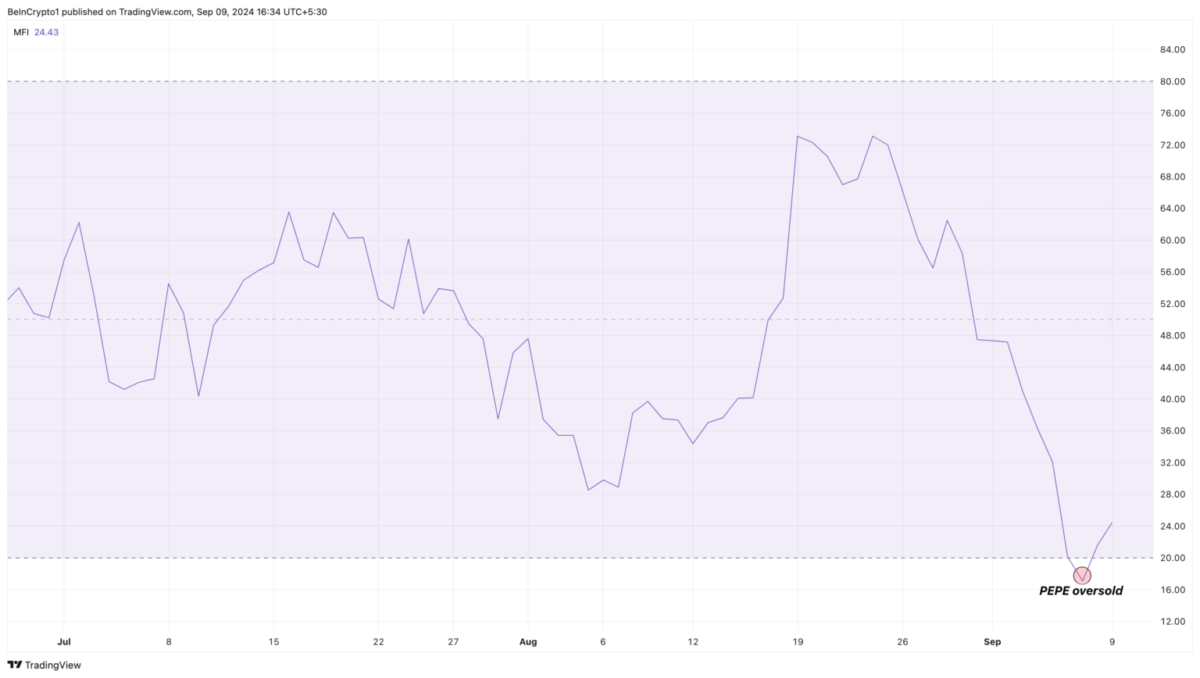
Another metric that supports the bullish outlook for the PEPE coin is the Money Flow Index (MFI), which helps in understanding the buying and selling pressure. The MFI index oscillates between 0 and 100 to determine whether an asset is overbought or oversold. A reading above 80 suggests the asset is overbought, while a reading below 20 indicates oversold.
Last week, on September 7, the MFI Index dropped to 17.25, putting PEPE in oversold territory. Currently, the MFI has surged slightly, suggesting that a bullish reversal could be coming ahead.
On the daily chart, the PEPE coin broke out of its downtrend over the weekend, rising from $0.0000066 to $0.0000070. Now trading at $0.0000070, PEPE is in a demand zone that previously pushed its price up to $0.0000087 between August 5 and 8.
The chart indicates that PEPE might aim to surpass the 61.8% Fibonacci retracement level at $0.0000079, which could serve as resistance. If buying pressure builds, the token could break through this level.
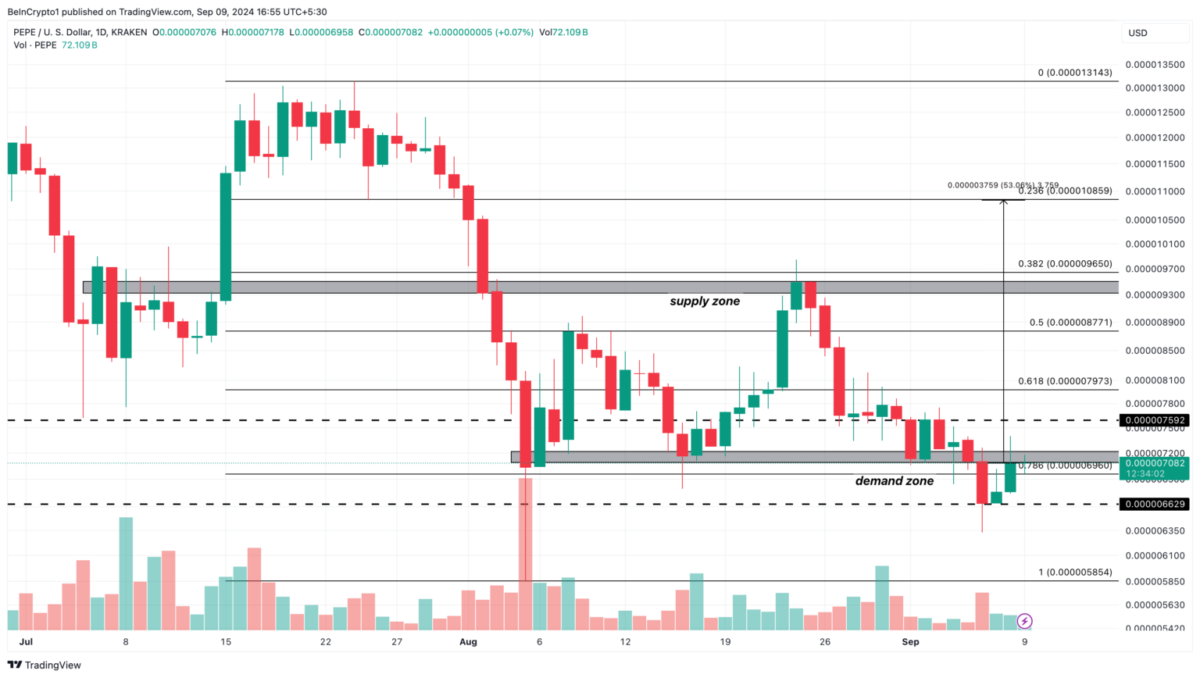
Another critical area to watch is the supply zone between $0.0000093 and $0.0000095, where PEPE has faced rejections in the past. Surpassing this zone could lead to a target of around $0.000010, representing a potential 53% gain from the current price. However, if PEPE struggles to break above $0.0000075, the outlook could change, possibly leading to a drop back to $0.0000066
No spam, no lies, only insights. You can unsubscribe at any time.
Related Posts

Mexico’s Battle Against Biometric Breaches: Is Worldcoin Watching You?
Despite assurances, Worldcoin faces bans in multiple countries over privacy…

From Meme to Mainstream: Crypto Whales Are Backing NEIRO and Two Fresh Tokens for Massive Returns During Altcoin Season
Prominent cryptocurrency investors are turning their attention to NEIRO and…

US Crypto Framework Could Include $81T Bitcoin Reserve
MicroStrategy co-founder Michael Saylor proposes a comprehensive crypto framework to…